4. Publisher & Subscriber Python
Writing your first ROS publisher and subscriber in Python
Summary
Estimated time to completion: 1'5 hours
Simulated robot: Turtlebot 3 Burger
What will you learn with this unit?
- What are ROS topics and how to manage them
- What are topic messages and how they work
- What is a publisher/subscriber and how to create one
- Debugging tools
What are ROS Topics: Publisher & Subscriber?
Topic Publisher
We will continue to use the first_pkg package that we created in the previous unit.
Create a new Python executable in the src folder of the package named points_publisher.py.
roscd && cd ../src/fhtw/first_pkg/src && touch points_publisher.pychmod +x points_publisher.pyWith ls you can check if a script is executable. It should be displayed in green and is maybe bold.
ls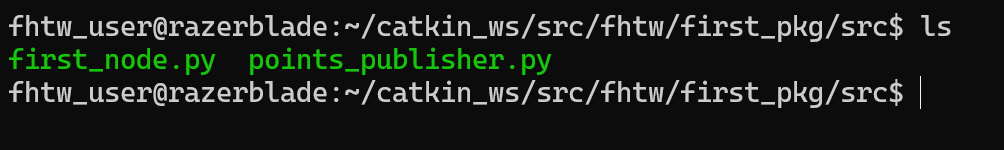
Paste the following code into points_publisher.py:
#!/usr/bin/python3
import numpy as np
import rospy        # Import the Python library for ROS
from std_msgs.msg import String      # Import the String message from the std_msgs package

rospy.init_node('points_publisher')        # Initiate a Node named 'points_publisher'
pub = rospy.Publisher('/points', String, queue_size=1)  # Create a Publisher object, that will publish on the /points topic messages of type Int32

rate = rospy.Rate(2)        # Set a publish rate of 2 Hz
house_points = String()     # Create a variable of type String
counter = 0                 # Create a counter
house = "Gryffindor"

while not rospy.is_shutdown():  # Create a loop that will go until the program is stopped
  house_points.data = "{} points for {}!".format(counter, house)             # Initialize the data part of the variable
  pub.publish(house_points)     # Publish the message house_points to the topic /points
  counter += 1                  # Increase the counter

  rate.sleep()                  # Sleep for the desired rate (2)
So, in essence, this code initiates a node and creates a topic on which a sequence of messages (String) on the /points topic.
To summarize: A publisher is a node that publishes a (number of) message(s) on a topic.
So now... what is a topic?
A topic is a channel that acts as a pipe (connection) for all ROS nodes to either publish or subscribe information (msgs) from. Now let's look at some commands that relate to topics (some of which you've already used).
Compile the Code
Go to the catkin_ws:
roscd && cd ..Build the package:
catkin_makeSource the workspace:
source devel/setup.bashCheck if the package is in the workspace:
rospack profileRunning the Publisher
Execute the following lines in 2 different terminals:
- In one Terminal start the
roscore:
roscore- Then with
[ctrl + b] and [Shift + 5]open a new terminal and run the publisher:
rosrun first_pkg points_publisher.pyNothing happening? Well... that's not actually true! We just created a topic named /points, and published through it as an integer that increases indefinitely. Let's check this out.
A topic is like a pipe. Nodes use topics to publish information for other nodes so that they can communicate. You can find out, at any time, the number of topics in the system by doing a rostopic list. You can also check for a specific topic.
- Open another terminal (
[ctrl + b] and [Shift + 2]) and type:
rostopic listNow check for a topic named /points.
- To request information about a topic type the following command in a terminal:
rostopic info /pointsThe output will look something like this:
Type: std_msgs/String

Publishers:
 * /points_publisher (http://192.168.0.3:47971/)

Subscribers: None
The output indicates the type of the message (std_msgs/String), the node (/points_publisher) that is publishing this information, and if there is a node listening (subscribing) to this topic.
- Now, type in a terminal:
rostopic echo /pointsCheck the output of the topic in real-time. The output will look something like this:
data: "130 points for Gryffindor!"
---
data: "131 points for Gryffindor!"
---
data: "132 points for Gryffindor!"
You've learned that a topic is a channel where nodes can either write or read information. You've also seen that you can publish (write) data onto a topic using a publisher.
Subscriber
So we just learned about publishers which publish data (messages) onto a topic. Now you might be thinking that if it is possible to write data on a topic we must also be able to read data from a topic ... and you are absolutely right.
To do that we must create a subscriber on a topic.
Create a new Python executable in the src folder of our package and name it points_subscriber.py.
roscd && cd ../src/fhtw/first_pkg/src && touch points_subscriber.pyMake also sure that the script is executable:
chmod +x points_subscriber.pyPaste the following code into points_subscriber.py file:
#!/usr/bin/env python3

import rospy
from std_msgs.msg import String

# Define a function called 'callback' that receives a parameter named 'msg'
def callback(msg):
    string_with_points = msg.data
    # Print the 'msg'
    rospy.loginfo("{} Dumbledore shouted".format(string_with_points))
# Initiate a Node called 'topic_subscriber'
rospy.init_node('counter_subscriber')
# Create a Subscriber object that will listen to the /points
# topic and will call the 'callback' function each time it receives
# a String from the topic
sub = rospy.Subscriber('/points', String, callback)
# Create a loop that will keep the program in execution
rospy.spin()
Execute the Subscriber:
- Start the
roscorein a terminal if it is not already running:
roscoreIn a new terminal ([ctrl + b] and [Shift + 5]) type:
rosrun first_pkg points_publisher.pyIn another new terminal ([ctrl + b] and [Shift + 2]) type:
rosrun first_pkg points_subscriber.pyThe output of the terminal where you started the subscriber should look something like this:
fhtw_user:~/$ rosrun first_pkg points_subscriber.py
[INFO] [1625150306.760391]: "1 points for Gryffindor!" Dumbledore shouted
[INFO] [1625150307.260223]: "2 points for Gryffindor!" Dumbledore shouted
[INFO] [1625150307.760462]: "3 points for Gryffindor!" Dumbledore shouted
[INFO] [1625150308.260736]: "4 points for Gryffindor!" Dumbledore shouted
[INFO] [1625150308.760445]: "5 points for Gryffindor!" Dumbledore shouted
[INFO] [1625150309.260435]: "6 points for Gryffindor!" Dumbledore shouted
Now let's explain what just happened. You basically created a subscriber node that listens for the /points topic, and every time it receives a message, it calls a function (callback) that prints a string to the screen. Initially, nothing happened because no node was publishing on the /points topic, but when you executed rosrun first_pkg points_publisher.py, data (messages) were published to the /points topic. It all makes sense now, doesn't it? Remember that another way to read the data on a topic is: rostopic echo /topic
Messages in ROS
As you may have noticed, topics process information via messages. There are many types of messages.
In the case of the code you ran earlier, the message type was std_msgs/String, but ROS provides many other messages. You can even create your own messages, but it is recommended to use ROS default messages if possible.
Messages are defined in .msg files located in the msg directory of a package.
- To receive information about the structure of a message you can use:
rosmsg show [message_type]- Let's have a look at the message type used earlier (
std_msgs/String):
rosmsg show std_msgs/StringThe output will look something like this:
string data- In this case, the
Stringmessage has only one variable nameddataof typeString. ThisStringmessage is from thestd_msgspackage and you can find it in itsmsgdirectory. If you want, you can view theString.msgfile by running the following command:
roscd std_msgs/msg/Exercise [30 min]
- Create a launch file
move_turtlebot.launchthat starts thehomework_simulation.launch. - Create a publisher file called
move_turtlebot.pythat moves the simulated robot in a circle. - Add
move_turtlebot.pyto themove_turtlebot.launchlaunch file.
Hints:
- The
/cmd_veltopic is the topic used to move the robot. Runrostopic info /cmd_velto get information about this topic and identify the message type used. - To fill in the
Twistmessage, you need to create an instance of the message. In Python, it goes like this:var = Twist(). - To know the structure of the
Twistmessages, you need to use therosmsg showcommand with the message type used by the/cmd_veltopic. - In our case the robot uses a differential drive plugin to move. This means that the robot can only move linearly along the x axis or rotationally along the angular z axis. This means that the only values you need to enter in the twist message are the linear x and the angular z variables.
Twist message values are in m/s, so it is recommended to use values between 0 and 1. For example, 0.5 m/s.
Exercise Solution
Create a launch file move_turtlebot.launch.
roscd first_pkg/launch && touch move_turtlebot.launchPaste the following code into the move_turtlebot.launch file:
<launch>
  <include file="$(find turtlebot3_gazebo)/launch/turtlebot3_world.launch" />
    <node pkg="first_pkg" type="move_turtlebot.py" name="move_turtle_node" output="screen" />
</launch>
Create a Python file move_turtlebot.py in the src folder of the package.
roscd && cd ../src/fhtw/first_pkg/src && touch move_turtlebot.pyMake sure the script is executable:
chmod +x move_turtlebot.pyPaste the following code into the move_turtlebot.py file:
#!/usr/bin/python3

import rospy
from geometry_msgs.msg import Twist

rospy.init_node('move_turtle_node')
pub = rospy.Publisher('/cmd_vel', Twist, queue_size=1)
rate = rospy.Rate(2)
move = Twist()
move.linear.x = 0.13  # Move the robot with a linear velocity in the x axis
move.angular.z = 0.26 # Move the with an angular velocity in the z axis

while not rospy.is_shutdown():
  pub.publish(move)
  rate.sleep()
You can now start the move_turtlebot.launch file:
roslaunch first_pkg move_turtlebot.launchNow the robot should move in a circle!
Debugging
Estimated time to completion: 1'5 hours
Simulated robot: Turtlebot 3 Burger
What will you learn with this unit?
- How can
roswtfhelp you debug - Add Debugging ROS logs to your executables
- Filter ROS logs
- Visualize connections between different nodes of your system
- Basic use of RViz debugging tool
One of the most difficult but important aspects of robotics is: knowing how to translate your ideas and knowledge into real-world projects.
Usually in robotics projects: nothing works like in theory. Reality is much more complex and therefore you need tools to figure out what is going on and where the problem is. For this reason, debugging and visualization tools are essential and already implemented in ROS, especially when working with complex data formats like images, laser scans, point clouds or kinematic data.
Examples are shown in the following figure:
ROS Debugging Messages and RQT-Console
We have used Python's print() and ROS's rospy.loginfo() so far throughout this course without discussing the benefits/downsides.
print(): Follows the Dark Lord into battle. If you useprint, it is close to impossible to store the information you print to the ROS framework.LOGS(): The logging system of ROS allows us to print them on the screen but also to store them in the ROS framework, so we can classify, sort, filter, or else on them later.
logging is provided in the rospy API
DEBUG-> rospy.logdebug(msg, args)INFO-> rospy.loginfo(msg, args)WARN-> rospy.logwarn(msg, args)ERROR-> rospy.logerror(msg, args)FATAL-> rospy.logfatal(msg, args)
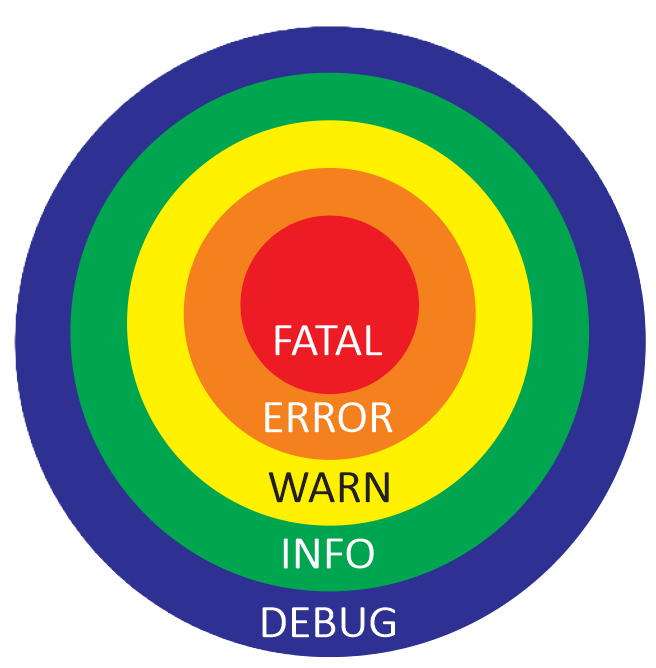
The ROS logging system contains five levels. Each level includes the deeper levels. For example, if we use the Warn level for our node, all logs from Warn, Error, and Fatal will be printed.
Example
Let's test the different logger levels.
Create a new node called logger_test.py in the first_pkg:
roscd first_pkg/src && touch logger_test.py && chmod +x logger_test.pyPaste the following code:
#!/usr/bin/python3
import rospy
import sys
import time
# Options: DEBUG, INFO, WARN, ERROR, FATAL
rospy.init_node('logger_test', log_level=rospy.DEBUG)
rate = rospy.Rate(0.5)
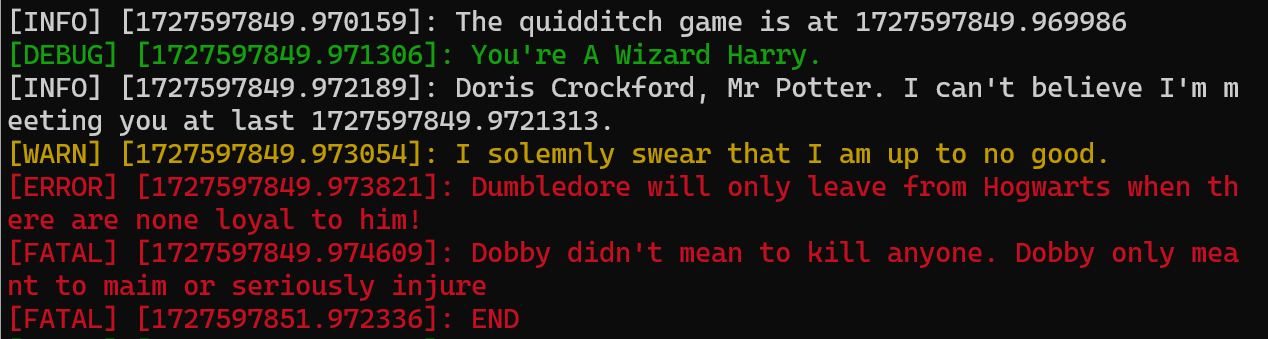
rospy.loginfo_throttle(10, "The quidditch game is at {}".format(time.time()))
while not rospy.is_shutdown():
rospy.logdebug("You're A Wizard Harry.")
rospy.loginfo("Doris Crockford, Mr Potter. I can't believe I'm meeting you at last {}.".format(str(time.time())))
rospy.logwarn("I solemnly swear that I am up to no good.")
rospy.logerr("Dumbledore will only leave from Hogwarts when there are none loyal to him!")
rospy.logfatal("Dobby didn't mean to kill anyone. Dobby only meant to maim or seriously injure")
rate.sleep()
rospy.logfatal("END")Start a roscore in a terminal if it is not already running:
roscoreMake a new Terminal with [ctrl + b] and [Shift + 5] and start the logger_test.py node in a new terminal:
rosrun first_pkg logger_test.pyThe output will look something like this:
Exercise [5 min]
Adapt the log level of the logger_test.py and inspect the output of the topic /rosout using rostopic echo.
Copy the following code into the logger_test.py file:
#!/usr/bin/python3

import rospy
import sys
import time

log_dict = {
    "DEBUG": rospy.DEBUG,
    "INFO": rospy.INFO,
    "WARN": rospy.WARN,
    "ERROR": rospy.ERROR,
    "FATAL": rospy.FATAL,
}

# Check if a log level argument was provided and if it's valid
if len(sys.argv) > 1 and sys.argv[1] in log_dict:
    log_level = sys.argv[1]  # Use the provided valid log level
    LOGGER = log_dict[log_level]  # Get the corresponding ROS log level constant
else:
    log_level = "DEBUG"  # Default to "DEBUG" if no valid argument is provided
    LOGGER = rospy.DEBUG  # Set the log level to rospy.DEBUG as a fallback

rospy.init_node('logger_test', log_level=LOGGER)    # Options: DEBUG, INFO, WARN, ERROR, FATAL
rate = rospy.Rate(0.5)

rospy.loginfo_throttle(10, f"The quidditch game is at {time.time()}")

while not rospy.is_shutdown():
    rospy.logdebug("You're A Wizard Harry.")
    rospy.loginfo(f"Doris Crockford, Mr Potter. I can't believe I'm meeting you at last {str(time.time())}.")
    rospy.logwarn("I solemnly swear that I am up to no good.")
    rospy.logerr("Dumbledore will only leave from Hogwarts when there are none loyal to him!")
    rospy.logfatal(f"Dobby didn't mean to kill anyone.\nDobby only meant to maim or seriously injure")
    rate.sleep()
Add the logger_test.py to the move_turtlebot.launch file.
<launch>
    <include file="$(find turtlebot3_gazebo)/launch/turtlebot3_world.launch" />
    <node pkg="first_pkg" type="move_turtlebot.py" name="move_turtle_node" output="screen" />
    <node pkg="first_pkg" type="logger_test.py" name="logger_test_node" output="screen" />
</launch>
Start the move_turtlebot.launch file again.
roslaunch first_pkg move_turtlebot.launchOpen another Terminal with [ctrl + b] and [Shift + 2]. Inspect the topic /rosout again starting the move_turtlebot.launch file.
rostopic echo /rosoutAs you have seen in the first part of the exercise, the amount of data is already large. On the third part of the exercise, with only 6 running nodes, /rosout was already really hard to follow.
Now imagine ten nodes publishing image data, laser data, using actions, services or performing computations and publishing debug data from your Deep Learning node.
It is really hard to get the logging data you want.
This is where rqt_console comes in handy.
RQT Console
- Start the launch file
move_turtlebot.launchwith the modifiedlogger_test.py:
roslaunch first_pkg move_turtlebot.launch- Start the
rqt_console:
rqt_console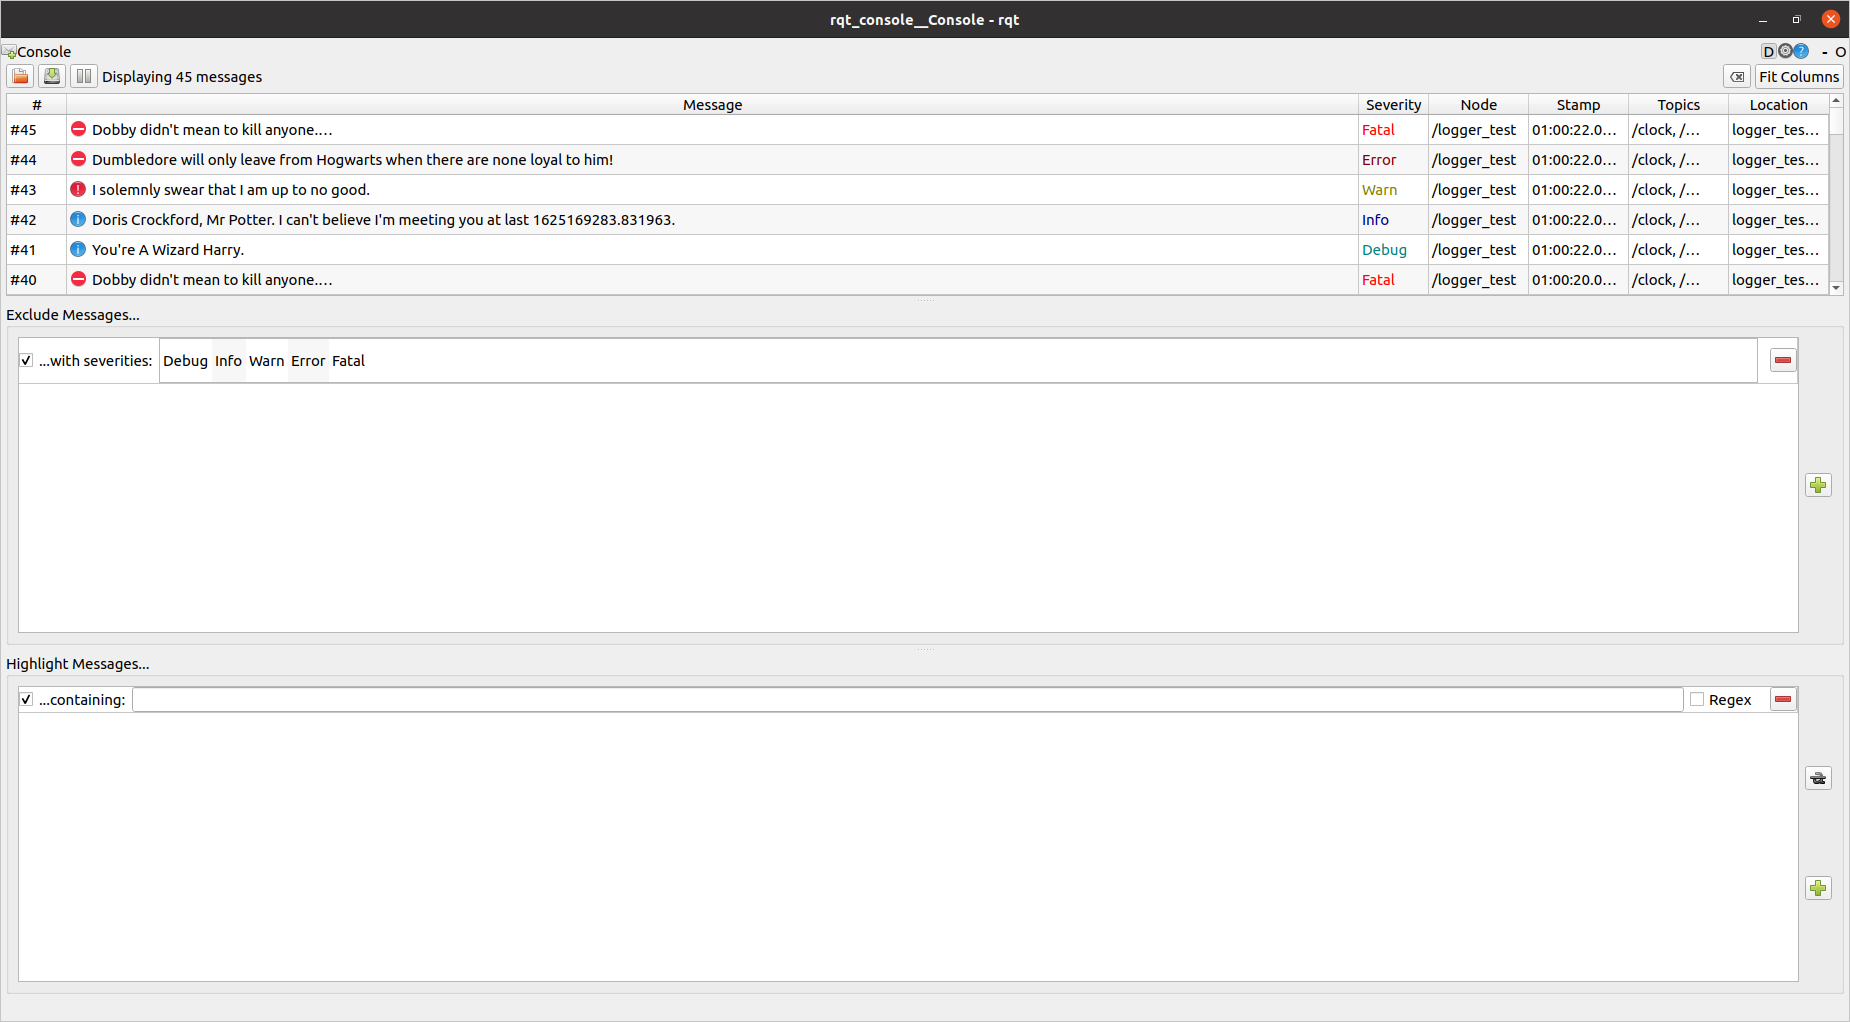
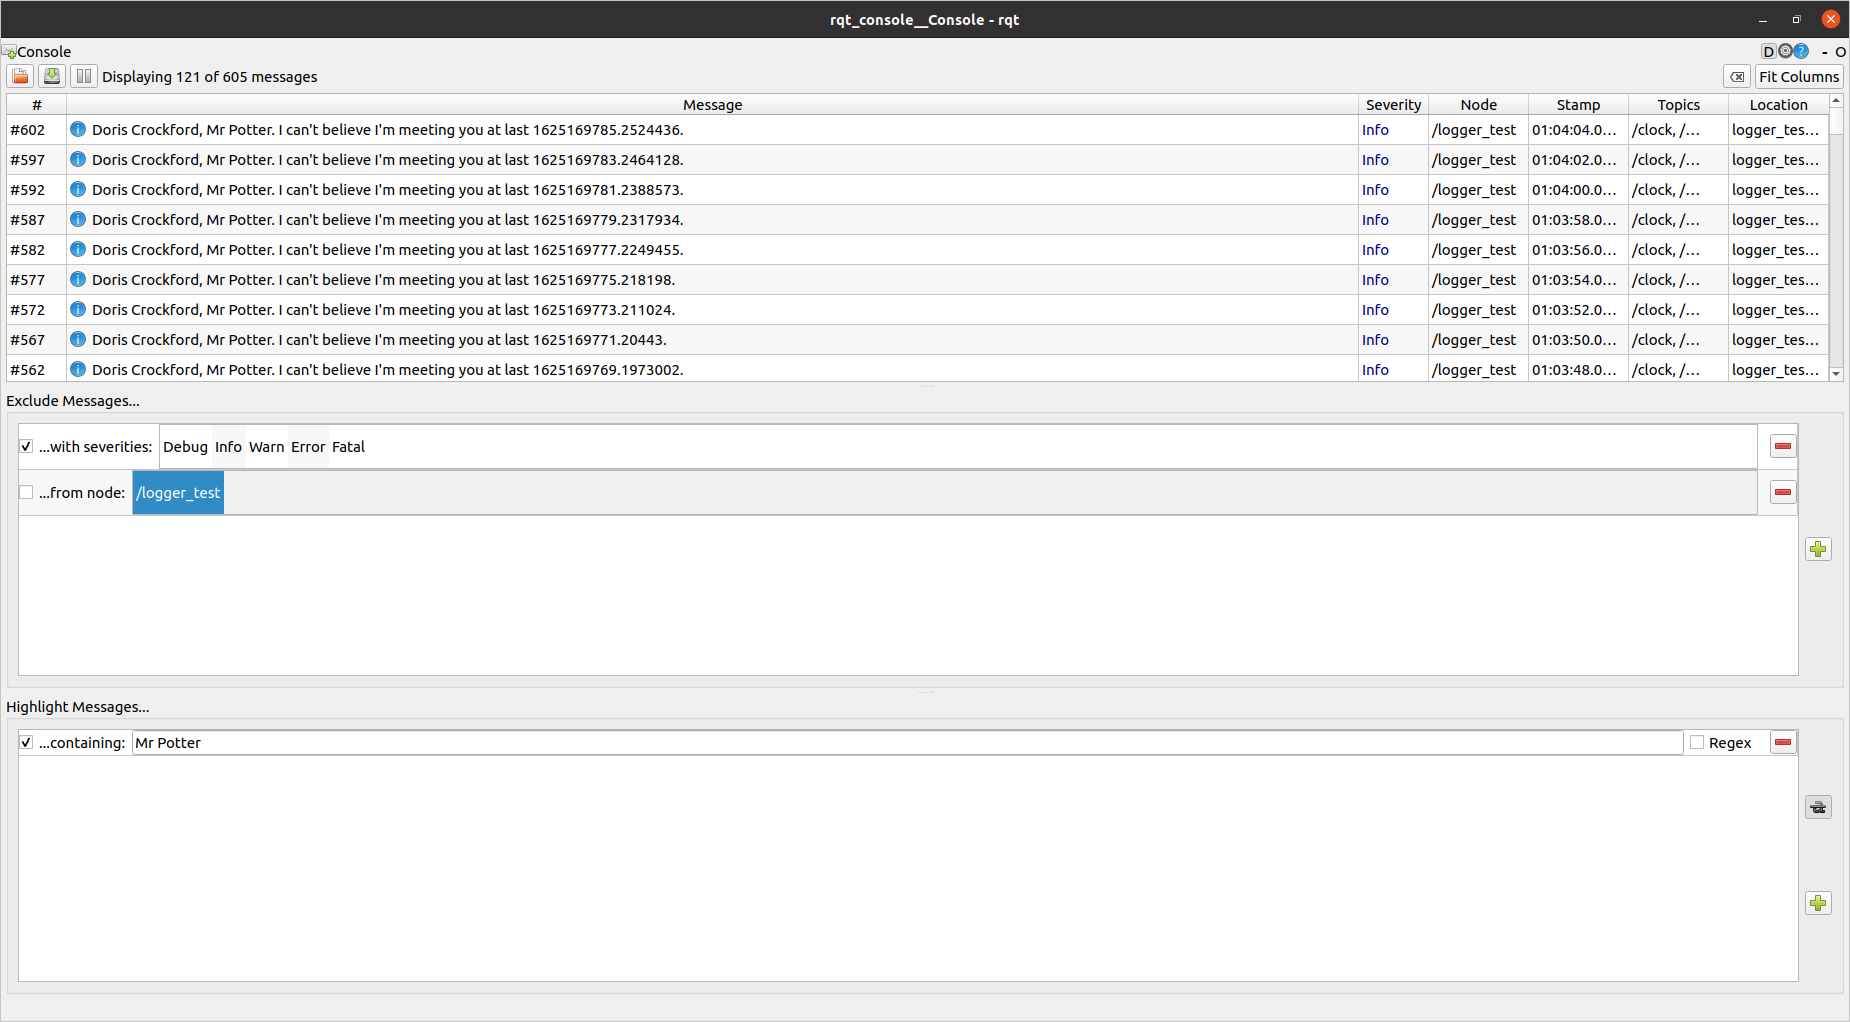
The rqt_console window is divided into three subpanels.
- The first panel outputs the logs. It contains data about the message, the severity/level, the node generating that message, and other data. This is where all your log data is extracted.
- The second one allows you to filter the messages output in the first window by excluding them according to criteria such as node, severity level, or that they contain a certain word. To add a filter, simply press the plus sign and select the one you want.
- In the third field, you can highlight certain messages while the others are displayed.
You also need to know that by clicking on the small white gear in the upper right corner, you can change the number of messages displayed. Try to keep it as low as possible to avoid performance degradation in your system. Further, using the small white gear it is also possible to set the log level of already running nodes.
RQT Plot
This is a very common need in any scientific discipline, but especially important in robotics. You need to know if your tilt is correct, your velocity is the right one,
the torque values in an arm joint are above normal, or the laser has anomalous readings. For all these different msg types, you need a graphical tool that can quickly
process all the data you receive in real time. This is where rqt_plot comes in handy.
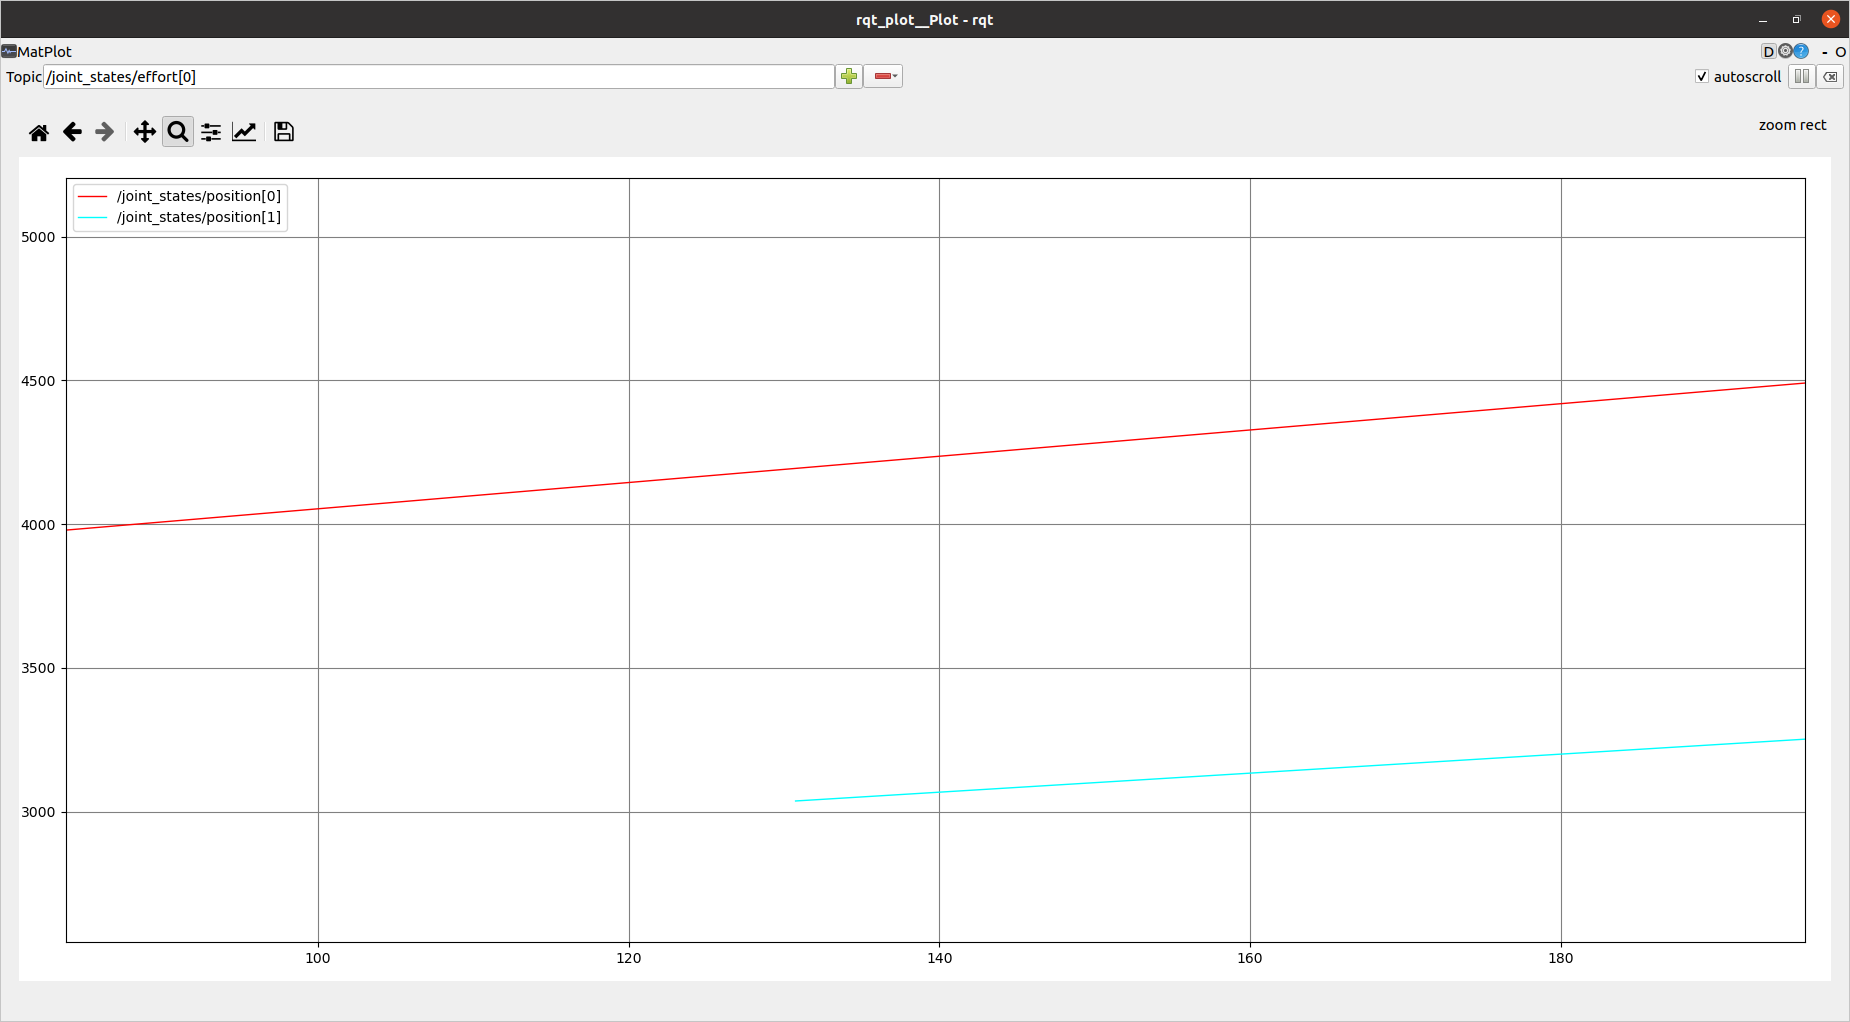
In the topic input located in the top-left corner of the window, you have to write the topic structure that leads to the data that you want to plot. Bear in mind that in order to be plotted, the topic has to publish a number. Once written, you press the PLUS SIGN to start plotting the Topic. In the case that we want to plot the robot joints, we need to plot the topic /joint_states, which has the following structure:
rosmsg show sensor_msgs/JointState std_msgs/Header header
uint32 seq
time stamp
string frame_id
string[] name
float64[] position
float64[] velocity
float64[] effortRQT Graph: Visualizing Node Connections
Is your node connected to the right topics? Why are you not receiving msgs from a topic?
These questions are quite common when developing ROS systems. rqt_graph can help you find
that out more easily. It displays a visual diagram of the nodes running in ROS and their topic connections.
- Start
rqt_graph:
rqt_graph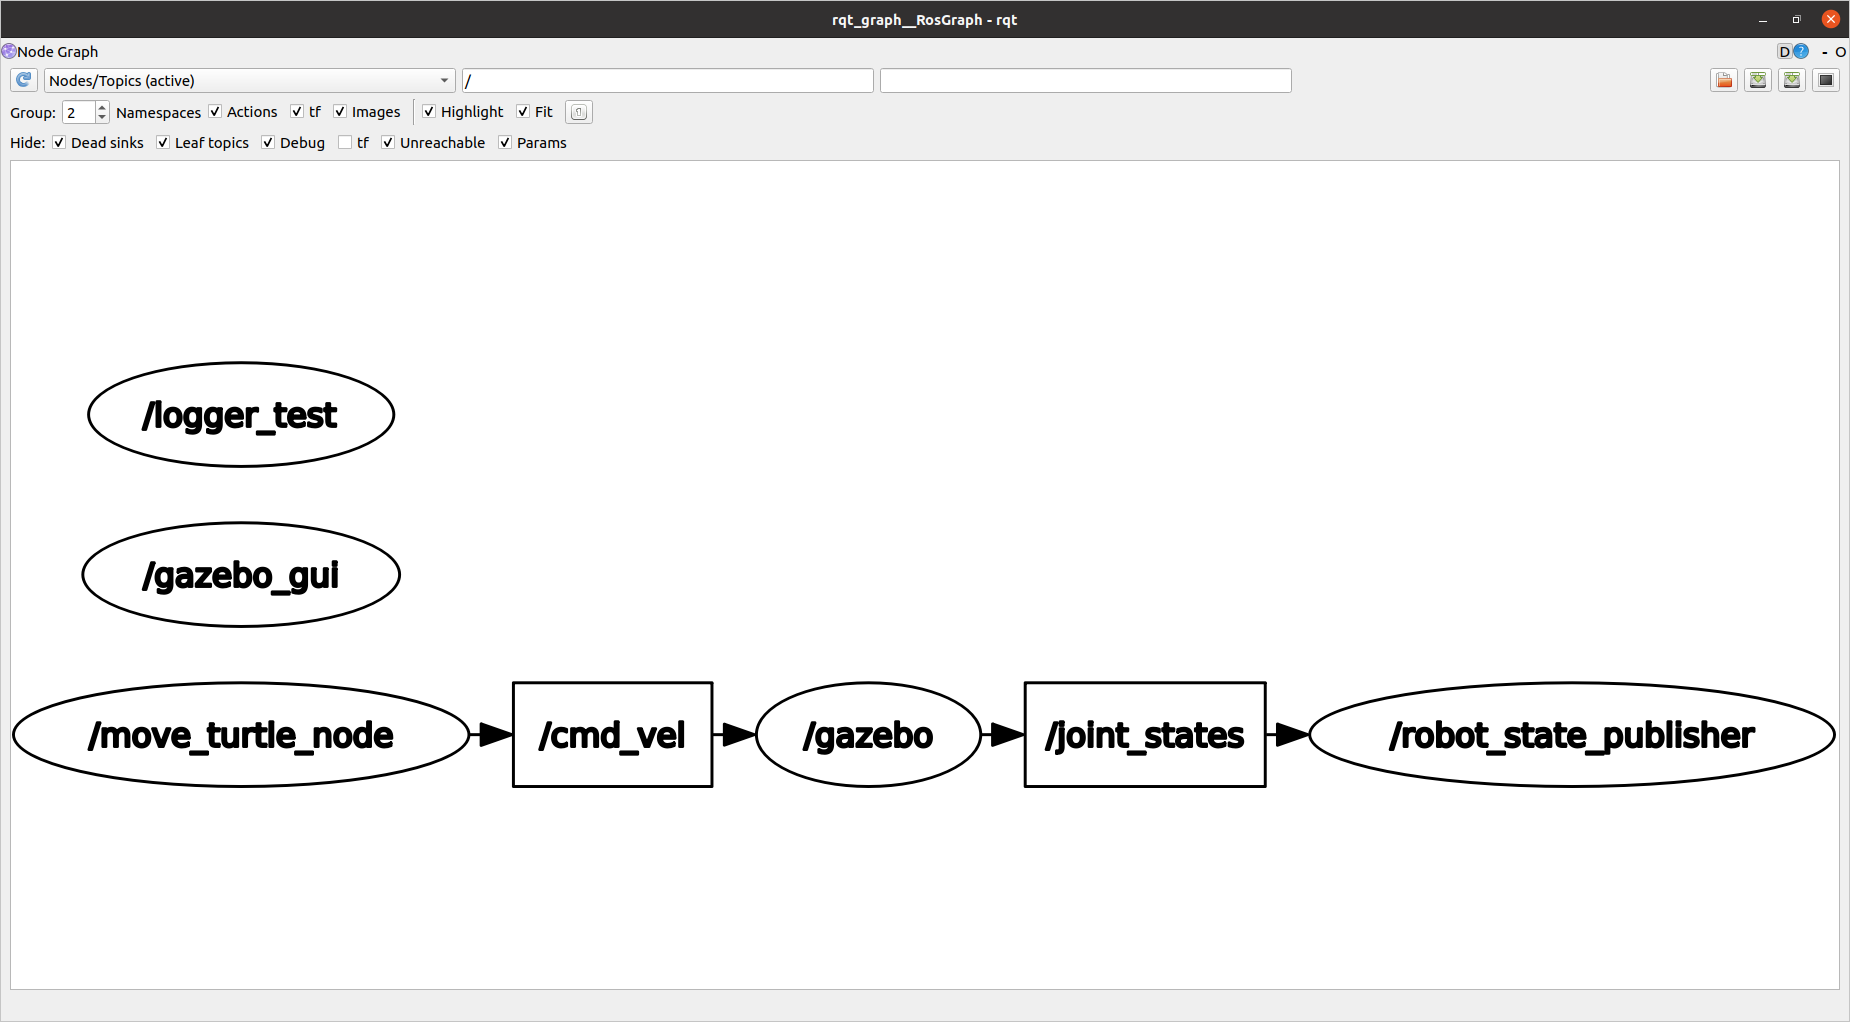
In the figure, you are presented with all of the currently running nodes, connected by the topics they use to communicate with each other (publish/subscribe). There are two main elements
that you need to know how to use:
- The refresh button: Which you have to press any time you have changed the nodes that are running.
- The filtering options: These are the three boxes just beside the refresh button. The first element lets you select between only nodes or topics. The second box allows you to filter by names of nodes.
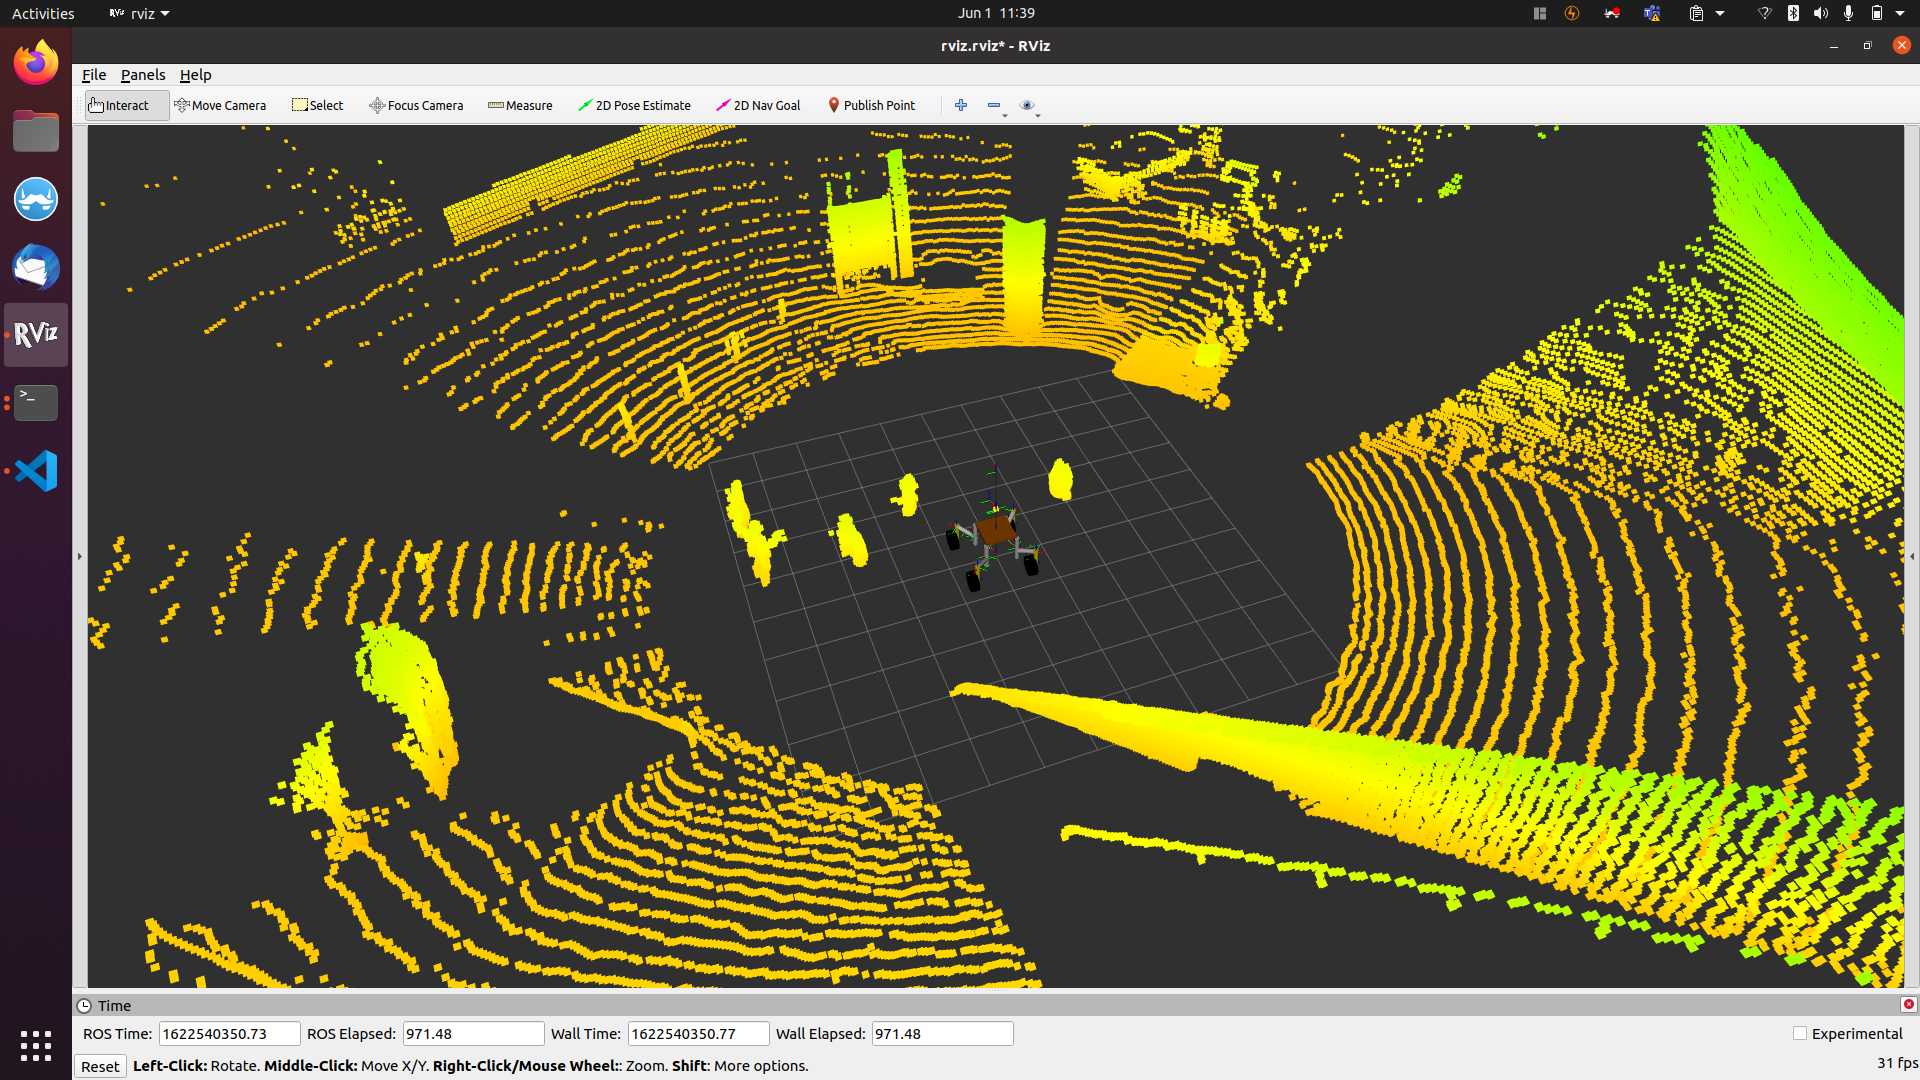
RViz
And here you have it. The HollyMolly! The Firebolt broom, the Cloak of Invisibility! The most important tool for ROS debugging....
RVizRVIZ is a tool that allows you to visualize images, PointClouds, 2D lasers, kinematic transformations, RobotModels, IMU readings, RGBD PointClouds, etc. You can even define your own markers. This is one of the reasons why ROS has been so widely accepted. Before RVIZ, it was really difficult to know what the robot was perceiving. And that is the main concept:
RVIZ is NOT a simulation. I repeat: it is NOT a simulation.
RVIZ is a representation of what is published in the topics, by the simulation or the real robot.
RVIZ is a really complex tool and it would take you a whole course just to master it. Here, you will get a glimpse of what it can give you.
Example
- Make sure the
roscoreis running in a terminal:
roscore- Start RVIZ in a new terminal
[ctrl + b] and [Shift + 5]:
rosrun rviz rvizor simply type rviz in the terminal.
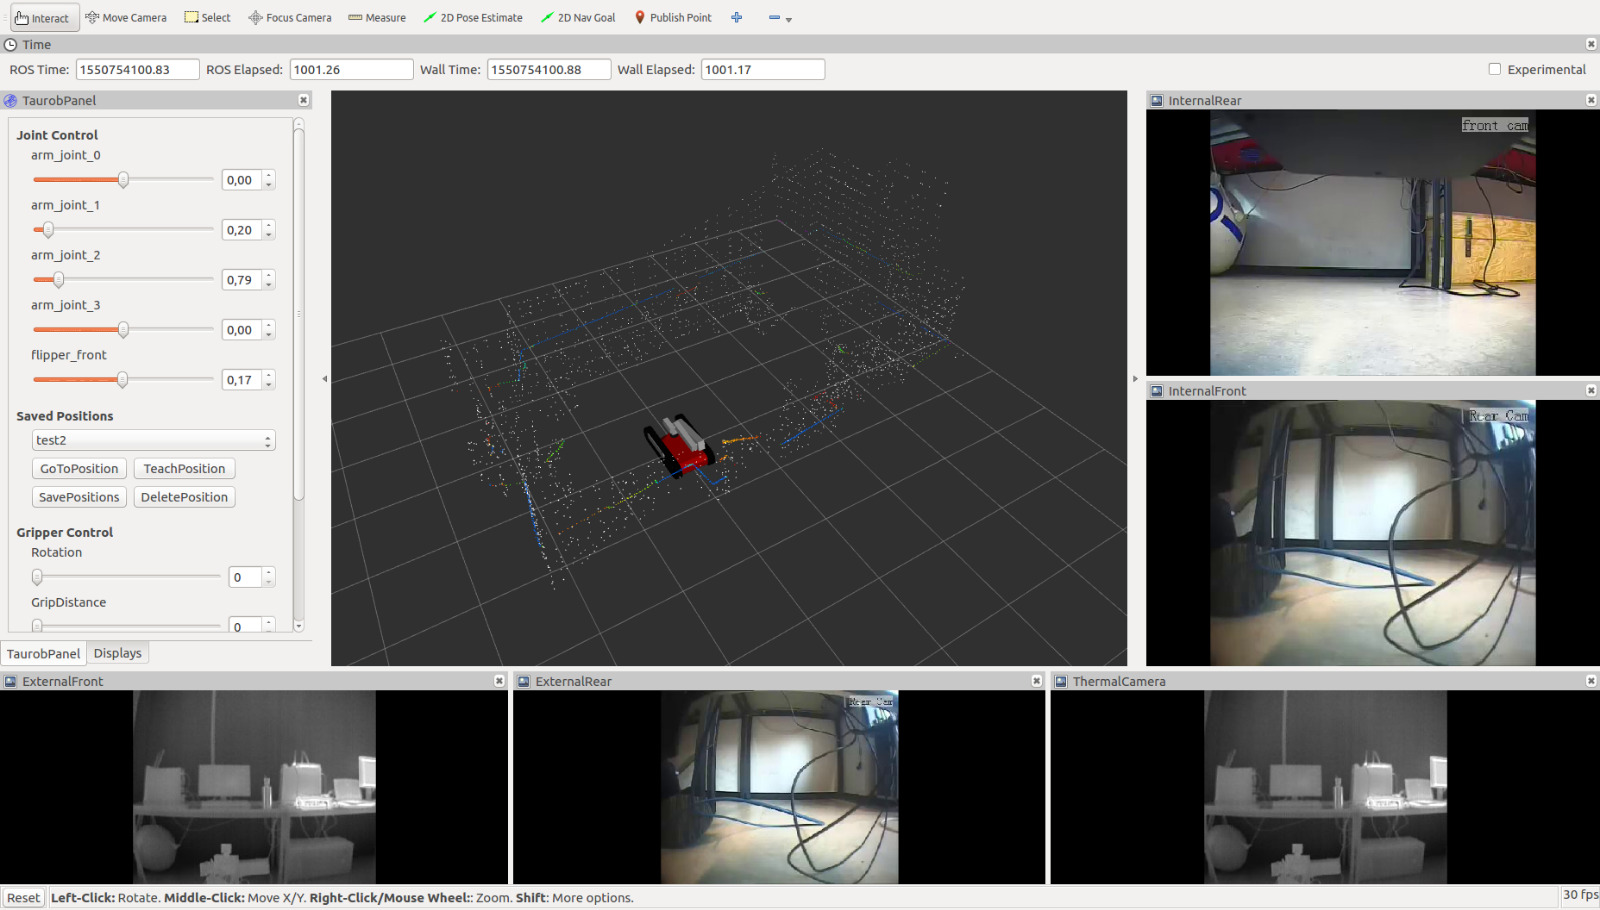
rvizAdd stuff that should be displayed as visualized in the video.
As shown in the figure, we can save the just created display configuration to a specific file, so we can load it using a launch file or the command line with rosrun rviz rviz -d <path-to-config.rviz>.
Homework [5 Points]
- Adapt the
move_turtlebot.launchfile so that it starts RVIZ with the following topics visualized:- The Robot model
- All coordinate frames (TFs) of the robot without their names
- The 2D laser scan topic
- Create a Python file
unit2_hw.pythat subscribes to the robot's odometry and laser scan topic, performing the following:[odometry]: Log the odometry message to DEBUG[scan]: Publish the 5 closest points of each sensor reading asstd_msg/Float32MultiArrayon the topicn_smallest
Hints:
- Load the RVIZ display-config by providing arguments to the node in the launch file
- Use the substitution arg
findordirnameto get the relative path of the RVIZ config file. - Convert the variable that holds the ranges of the laser scan data to a numpy array to ease computation
std_msg/Float32MultiArray can be declared as below:
from std_msgs.msg import Float32MultiArray
from numpy import asarray

# Option A
msg = Float32MultiArray(data=[20, 30, 4, 22, 16])

# Option B
array = asarray([20, 30, 4, 22, 16])
msg = Float32MultiArray(data=array)